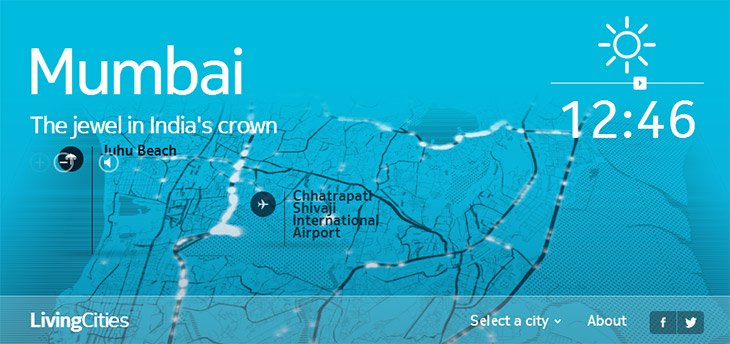
Are you interested in seeing the visualized data on traffic of crowded Mumbai city over a day, then head over to Nokia Here LivingCities. Nokia Here team worked with cloud mapping team at CartoDB to build a visualized map called ‘Living Cities‘ to see traffic density in five cities around the world including Mumbai in India. It uses the data continuously and anonymously collected by HERE through users smartphones and cars in five major cities including London, Chicago, Rome, Helsinki and Mumbai over 24 hours and then visualize the data to an interactive map.
In Mumbai city it analyzes and visualizes transit information, dynamic demographic information such as neighborhoods, points of interest, and other facts. It collects data from 18million people and 1.8million vehicles covering an area of 1,900 km of road. Users can view how a city changes through different times of the day like you will see heavy white dots movement (representing traffic) during the day and evening time which is the busiest time in Mumbai city, along with sounds (vehicle horns). In addition users can also learn various facts about the city, neighborhoods, places, and people. As it’s a interactive map users can control map like zoom in/out and share facts in social networks.

The map makes use of HTML5 technology to animate geospatial data sets over time with the data been aggregated by HERE and hosted on CartoDB to be used in the visualization. With this Nokia aims to inspire developers to take advantage of Nokia’s Here data APIs and help them to build new innovative services using it.
Here what we got while looking into the traffic stats of Mumbai city during the past 24 hours –
Explore – Nokia Here LivingCities Mumbai


