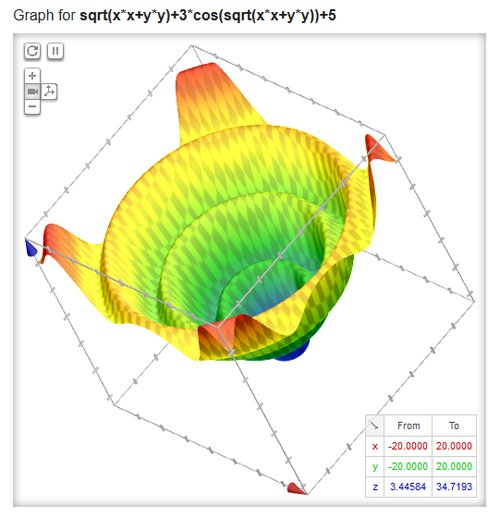
You might know that search engine giant Google has got a graphing functionality inbuilt in there search engine, using this graphical calculator users especially students and maths lovers can plot functions in an easy, simple way. Google has now expanded its graphical calculator feature to support 3D and animated plotting as well.
Now if you want to try this out, type any of this math variable functions in the Google search box –
sqrt(x*x+y*y)+3*cos(sqrt(x*x+y*y))+5 from -20 to 20

sin(5.5x)*cos(5*y)+x*x+1 x is from -1 to 1, y is from -1 to 1, z is from 0.1 to 2.8

tanh(y(y^4+5x^4-10(x^2)(y^2))/(x^2+y^2)^4)
You will now see a dynamic, interactive, three-dimensional plot for the variable function. Click anywhere in the graph to rotate it 360degree and to check out different angles, or scale the view by zooming in or out, or by editing the range in your equation or in the lower-right legend box.
According to Adi Avidor, Google Engineer on Google blog “This feature is enabled by a technology called WebGL, which we’re using for the first time in Google Search. WebGL is a new web technology that brings hardware-accelerated 3D graphics to the browser without the need to install additional software. This technology is currently supported on modern web browsers such as Chrome and Firefox.”
Watch out our video on this –
This new feature has been rolled out globally so, if you want to try out, then head over to Google.com and enjoy the enhanced graphical feature from Google.


